Oz is firing up early this year.

That's your standard response to anything that does not agree with your ideology but you are happy to post anecdotal newspaper reports from colonial times. Go figure.

And a very good response it was .... ;)

I have no ideology on climate: I deal only with facts. And, what's wrong with anecdotal newspaper reports? Not science, but certainly records.

You too can download the long-term Australian temperature data and produce the graphs; I did it for the Cape Otway Lighthouse station before my last post (just to be sure ;)). A copy of the data is available here .....
https://dl.dropboxusercontent.com/u/20066975/IDCJAC0010_090015_1800_Data.csv
...... for you to check. The other sites can be downloaded too, as monthly or daily entries.

Go on, have some fun ..... :)

Get away from the short-term stations and those that are either badly-sited or suffering from UHI, and the "hot Australia" story loses credibility. Same applies in the United States.

PS: A few more facts:
The US hurricane season looks like being the quietest in forty-five (45) years.
Antarctic sea ice remains at historic highs.
Arctic sea ice is at the highest level for at least eight years.
All indications are for another bitter NH Winter.
The polar bears are fine.
Coral reefs are fine .... everywhere.
Al Gore will save the planet.


PPSS: I know that you know that I'm wrong. ;)
 

Diwundrin said:
Japan just got splashed with another tsunami. Now should we spend the next few years arguing what caused the apparent increasing frequency of tsunamis relevant to the last millennium,
No, because earthquakes cause tsunamis and earthquakes are effects of the internal heat engine of the earth and nothing to do with human activity. Not building at sea level is not practical either but lessons are being learned about evacuations and disaster recovery.

We need to be similarly prepared for our particular weather/climate related disasters that will keep coming, with likely increased frequency and intensity.
 
Still going, 'watch and act' status. They're working on spotfires around property and letting them burn where it doesn't matter. The fires won't go out until they get rained on. Not point in putting them out in unpopulated areas anyway, they're burning off now what won't be able burn when it gets hotter and harder to handle. It's the good 'burn off' it desperately needs up there, compliments of the military.
 
Donander said:
You too can download the long-term Australian temperature data and produce the graphs; I did it for the Cape Otway Lighthouse station before my last post (just to be sure ;)). A copy of the data is available here .....
https://dl.dropboxusercontent.com/u/..._1800_Data.csv
...... for you to check. The other sites can be downloaded too, as monthly or daily entries.

Go on, have some fun ..... :)
I did have a go at it but there was so much data that I tended to lose concentration after a while and my ten year averages can't be relied on for total accuracy but it looked like I was getting something like a rough sine curve plotted from 15 ten year averages. What did you get ?
 
I did have a go at it but there was so much data that I tended to lose concentration after a while and my ten year averages can't be relied on for total accuracy but it looked like I was getting something like a rough sine curve plotted from 15 ten year averages. What did you get ?
I didn't try to refine the data in any way (unlike some scientists ... NLACGB ;)):


CapeOtwayTemps.JPG


Even THAT rough is enough to show a that there is no trend visible, I think. But is only max. temps.
 
I'll have another go at the ten year average maximums when I've got time.
I drew a line graph and it looked perplexing, to say the least.

I know exactly what you mean ... I might have another go sometime with the monthly data because the daily stuff takes so long to draw with even the slightest change. Might pick another station or two.

I tried Wilcannia (Reid Street) - operational since 1881 - and asked to download all available data and got stuff starting in 1957. I'll try again .... but you will remember that I have often said Australia's weather records are crap. ;)

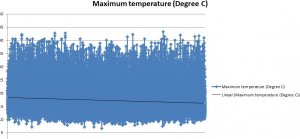
In the meantime, I put a linear trend line on my Cape Otway graph .... obviously not near any city or airport and obviously not getting hotter (if I got it right :)):

CapeOtwayTemps.JPG
 
In the meantime, I put a linear trend line on my Cape Otway graph ):
Did you draw it manually or use one of the statistical functions?

I've been having another go at the data attempting to separate out just one month (October, as it happens) and calculating averages per year and per 5 years. It's still very tedious and I'm not sure I've done the sorting properly so I'm not confident I'm processing properly.
I am learning a bit more about the power of Excel though and it's a good exercise.

I'm trying to tease out an XY graph of average max temperatures against time. I'm not there yet.

I used an internal Excel graph function Warrigal .....

PS: How's the book coming? :eek:

Re your comment "I'm not there yet", with Excel, I'm sure nobody is ever "there" .... ;) I gave up and watched some recorded shows. Might have another go tomorrow. Good luck with picking out months. Why October specifically?
 
October? No reason except that it has been in the news lately.
I'd have been better to pick January or December because of the sort functions. More convenient.

Wilcannia would be interesting to compare with Cape Otway - inland compared to coastal - but I'm not volunteering to do all the necessary processing.
 
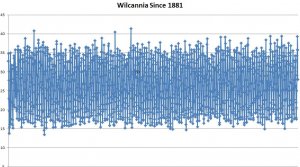
Warrigal, the Wilcannia data appears to be available only as monthly data whereas the Cape Otway stuff was daily. For some reason, I can't get a trend line to stick for Wilcannia but here is graph from the raw data:

WilcanniaSince1881.JPG


I've had a go at manipulating the Otway data to extract monthly averages but Excel is fighting me. :mad:
 
Got any figures from Coober Pedy and Marble Bar? They've always been nice warm spots to get excited about. 50+ happens a lot out there.

You two impress me no end. I have to keep my head down in this one, numbers short my circuits out.:(
 
You'd better hope he doesn't take that as a challenge.

I was pleased to see tonight that somebody at least is looking at the practical side of living with the fires instead of arguing over what's causing them. They're working on building codes, just as houses built in cyclone zones cost a lot more, so now will those built in fire prone areas. They even mentioned restrictions on what goes into gardens... yea, about time!

They've found the Marysville fire, among others, was triggered by a short in the power lines so now it's turn off the power on extreme fire weather days... or bury all the power lines. That will cost just a lazy 40 billion. Mmmmm lemme think. Think I'll buy shares in a generator company.

Anyway the fact remains that the fires have always been happening, the rate doesn't matter really, each house only burns down once whether they're lit up every year or every 5 or 10. It doesn't matter what causes their frequency or what actually ignites them in the long run. Surviving, mitigating damage, and adapting to them is all that matters and it's good to know that at least someone is working on that.:)
 
So true Di.... bushfires have been a part of this countrys' history long before the white man ever set foot here. There was nobody to "fight" the fires a couple of hundred years ago and yet, the bush still survived.
In days of old, the Aborigines actually started many blazes to flush out wildlife for their daily food supply.

The bush and landscape is now blackened by the recent bushfires, but come back in a few weeks time and you'll see a transformation from charred forest to glorious shade of fresh green growth. Sometimes, natures way of stimulating new growth is to burn out the older growth & rubbish.

The burnt out houses ?.... maybe they should never have been built there that close to the bush in the first place.
 
We're just playing.
I've lost interest in the data already.
I may have to be goaded into completing the analysis.

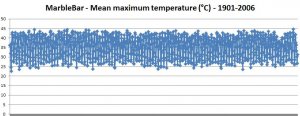
I looked at Coober Pedy and they have data files for 1965-94 (probably to PO) and then 1994-present (Airport). The BOM has been doing this shifting/closing business all over the country and any long term trend - in my humble opinion - whether warming or cooling, is impossible to discern. To demonstrate the mess Asutralian records are in go to http://www.bom.gov.au/climate/data/stations/ and pick a few places to check.

MarbleBar_1901_2006.JPG


Maybe Warrigal has lost interest because the regional records show no trends ??? Warrigal?
 
Thank you Tezza. Someone at least gets the point.

What do you reckon about the people howling for compensation for spending a couple of nights in a Motel because they left their houses to chance and the volunteers? They want to claim from the disaster fund even they didn't lose anything at all. Really??

I find it hard enough to summon sympathy for the ones who got burnt out let alone feel the need to compensate those who didn't.

I didn't light the fires. Nor did I coerce them into building a house in a tinder box. To me they equate with those who buy beachfront properties and fence it off so the hoi poloi can't share their little patch of paradise. Then they demand that those they fenced out contribute increased rates to the Council to pay for shoring up their eroding properties from the sea washing it away when a biggish storm crops up. Get real. Caveat Emptor... if you buy or build stupidly then pay the price.
 
I was thinking of moving to a place like Marble Bar, I like it hot, but the infrastructure is a bit lacking. :)

That graph looks pretty steady, doesn't even register the 50+ days, maybe it's cooling off up there?
 
Common sense at last ....

Climate change and bushfires - you’re missing the point!


  • We need to get serious about land-use planning. It is not a very sexy topic, it may not constitute the “great moral … challenge of our time”, but reducing our vulnerability to natural disasters is important and stands to benefit all Australians, directly or indirectly, now. Regardless of what you might think about climate change.
http://theconversation.com/climate-change-and-bushfires-youre-missing-the-point-19649

Have I mentioned before that there is no link between bushfires and climate change?
 
Told ya before, tax 'em for building there, withdraw all insurance, or clear fell the eucalyptus scrub back a kilometre. Oh, and stop planting fire bombs in gardens! Too easy!
 
Better half was reading a gardening magazine this afternoon; they recommended - slightly tongue in cheek - no combustible bush within a half hour's walk of your house.


Back
Top